Build your own serverless ECS Instance monitor
When dealing with critical ECS instances, specially the ones running our applications, many times we worry about their performance all the time, sometimes to the point in where we need to pay or learn to use a number of platforms in order to monitor it. Although you can create automatic alarms using CloudMonitor, sometimes you just want a permanent overview about what is going on with your resources.

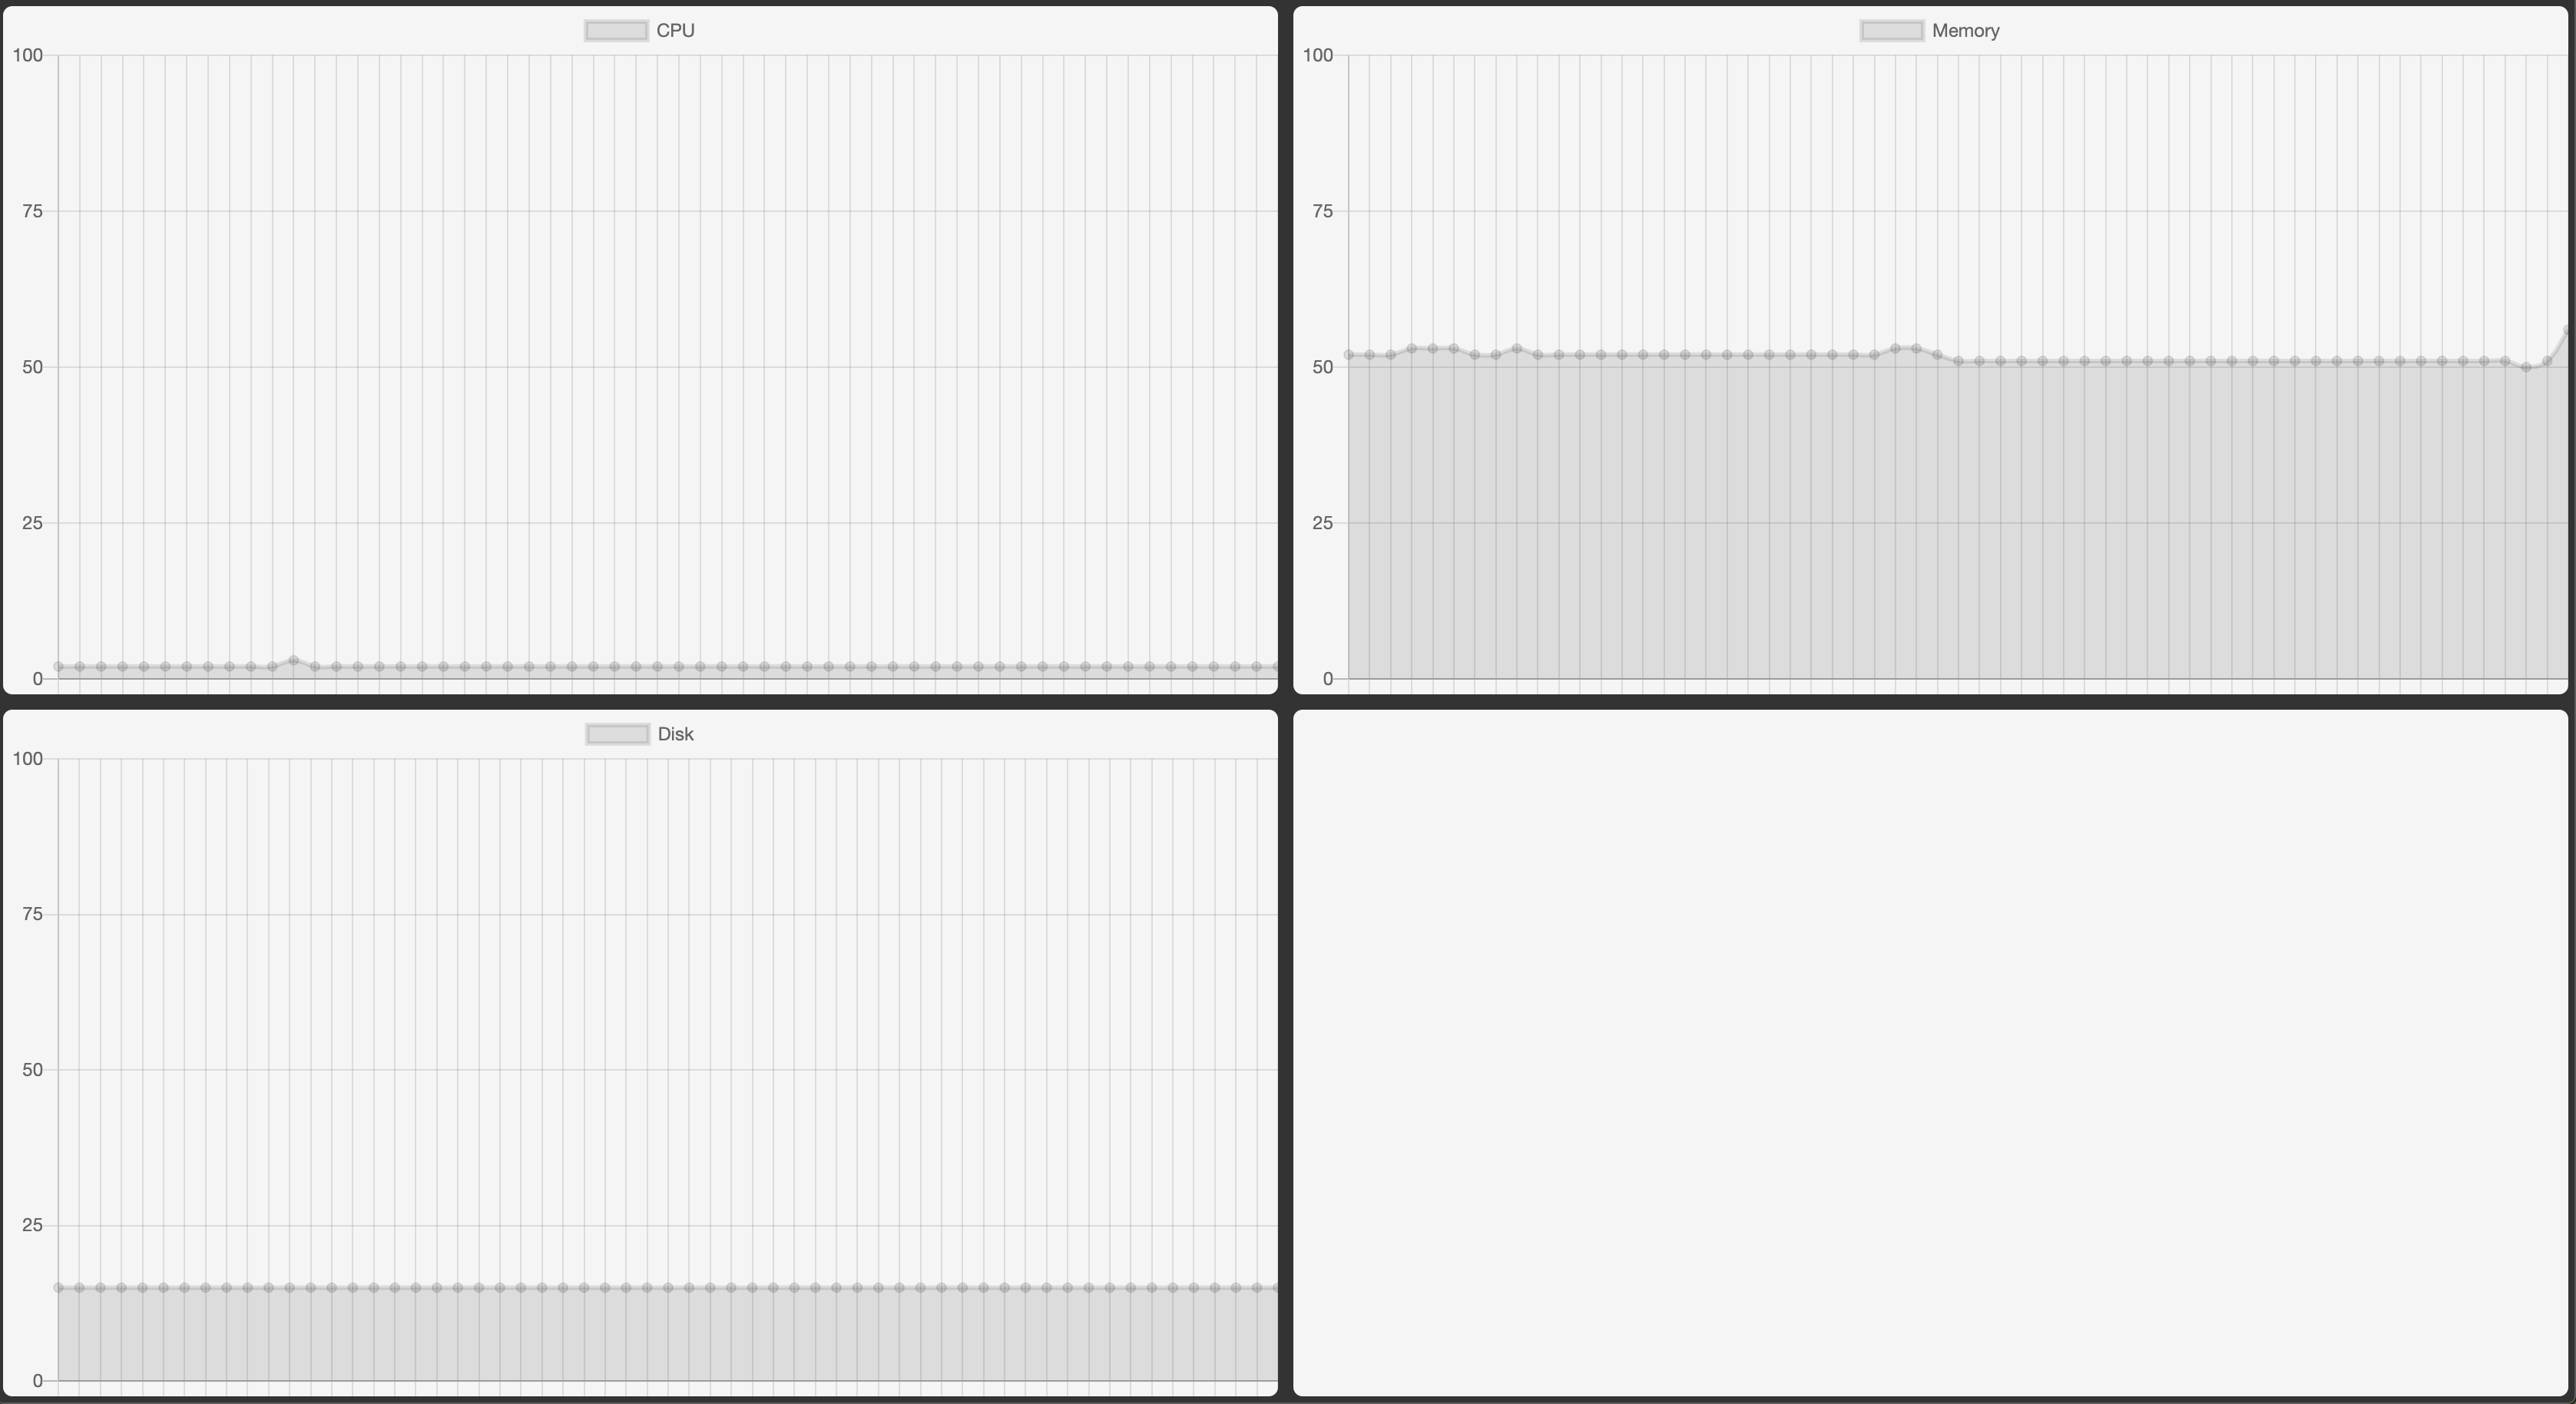
In this tutorial we will build a TV screen monitor that will show CPU, Disk and Memory usage in an almost real-time fashion. In this way you can keep a permanent eye in that ECS instance that gives you so many sleepless nights.
Overview
As a technical overview, we are going to show you how to leverage Alibaba Cloud’s Serverless framework, Funcraft, to create this simple TV ECS Monitor. For this example, we will use CloudMonitor, API Gateway, Function Compute and Alibaba Cloud’s Nodejs SDK for the backend. For the front-end we will leverage OSS to host the JS mini-app.
The monitor we are creating will accept the ECS ID and Region ID as GET parameters. This way, if you have more screens, you could monitor multiple Virtual Machines at the same time in a “Mission Control Center” fashion. Thanks to the multiple metrics that can be enabled in CloudMonitor, you’ll have a good understanding about what is going on just by looking to the screen.
Let’s do it
First of all, I’ll assume you already have an ECS instance you want to monitor. But if you don’t have one yet, follow this guide to create one. Now, with the instance created, be sure you have the agent installed on it. This agent allows you to monitor your servers consistently and can be used to report a variety of metrics that doesn’t come by default in the base ECS images.
The agent shouldn’t affect the performance of your machine, as is a very optimised tool that occupies about 70 MB of memory, 1% to 2% of one core’s CPU usage and around 200 MB of disk space (logs will use a maximum space of extra 40 MB). About network usage, all reporting will use intranet bandwidth, being this around 10 KB every few seconds.
To make everything easier, I created a GitHub project for you, you can clone/fork it by going to github.com/cirrusaudit/ecs-serverless-monitor. I’ll guide you step by step with each part of it so you’ll be able to make it work and/or modify it for your own use-case.
Backend
As said above, we will use Alibaba Cloud’s Serverless framework called Funcraft (aKa Fun) to deploy all the backend bits as API Gateway and Function Compute (if you don’t have Funcraft installed you can just make it globally available in your machine by running npm install @alicloud/fun -g). Start by setting your credentials into the .env file you can find in the root directory of the project. To get the keys, log into the Alibaba Cloud web console and, from the top-right corner, click on AccessKey. Once in the Security Management screen, copy the Access Key ID and the Access Key Secret. The rest of fields are just your Account ID and region where you will deploy the backend.
Files in this repository
If you feel curious about the different bits found in the repo, I can tell you that the actual backend logic lives in /getStats.js, the API definition (swagger) is under swagger.yml and the file tying everything together is template.yml.
getStats.js
This is where the magic lives, as is where the Alibaba Cloud NodeJS SDK is loaded and the actual CloudMonitor requests happen. This function receives the request from the API with a number of GET parameters such as regionId, instanceId and time. This script will try to pull metrics like CPUUtilization, memory_usedutilization and diskusage_utilization, basic metrics of a normal ECS instance. As you can see, I’m using Promises, if you need to pull more metrics, just drop a request to the PromisesArray array.
swagger.yml
This is a swagger file that defines the API endpoints and their argument types. If you want to learn more about Swagger, check their documentation. Knowing this tool will help you a lot not only with Serverless, but with anything to do with APIs in general and with its consistent creation.
template.yml
In Funcraft, this file defines all the resources that will be created. In our case, it will create a Log Store, one Function Compute Service with one function inside and one API Group with one endpoint. Here you can see, as example, one of the most important parts. Instead of providing a key pair with full admin access, we are attaching the AliyunCloudMonitorFullAccess policy to the Function Service, this way it will be able to pull data from it (which is the point here). To make the request, the getStats.js script uses the temporary securityToken to be used in the request, a one-time token that increases overall security.
Deploy the Backend
If you are happy with the logic and structure of the backend, just go to the root directory, next to the template.yml file and run fun deploy. This will orchestrate all the resources.
Test the backend by going to https://<YOUR_API_HERE>.alicloudapi.com/getStats?token=<TOKEN_HERE>®ionId=<REGION_ID>&instanceId=<ECS_ID>&time=600. All good? Let’s do the Frontend!
Frontend
With the backend already in place, we can start having a look to our frontend bits. Since this will be a completely client-side application, you can develop and test it locally with no need of a web server or any more complex setup with Docker or virtualization tool.
The files are inside the /oss folder. We chose not to use a framework, as in my opinion this monitor dashboard would potentially run in very limited machines like Raspberry Zero or other low-spec devices. If you want to convert this into a bigger application, I recommend you use VueJS. If you want to tweak something, just open the code and follow my instructions to know how to connect it to the backend we just created. In this case, go to /oss/index.html and edit the const called apiBase with the endpoint of the API we got from last step’s console output.
To test, open /oss/index.html with 2 GET parameters in the URL, instanceId and regionId with the ones of your ECS instance. Check that everything works as wanted, the screen will look better in something around the resolution of FullHD, which is the most common one found on TVs. To change how it looks, you just need to tweak the CSS found inside the /oss/index.html file. The included style is just basic and is up to you how you want it to look :)
Once happy with the results, you can push the contents of the /oss folder into an OSS bucket and that way you will have a fully serverless monitor that will cost you zero dollars to run and that will look so nice on one of your monitors.
Conclusion
By now you would know how to enable and monitor multiple metrics in CloudMonitor, but not only using the console, but also through the API. Also, if you followed the instructions closely, your knowledge of Alibaba Cloud’s Serverless Framework will let you explore further and create your own solutions based on it.
Good luck and good monitoring!
Republished from: Build your own serverless ECS Instance monitor.